What is an Average True Range (ATR) calculator?
An Average True Range (ATR) is a custom-made device for assessing market volatility based on what the average true range is for a specified number of periods. It works by first calculating the true range for each period. The true range is simply the maximum of the following three calculations: the current high minus the current low; the absolute value of the current high minus the previous close; and the absolute value of the current low minus the previous close. The ATR then simply gets the averages of the true range values and uses a moving average smoothing technique known as Wilder’s moving average to achieve a consistent measure of market volatility.
An ATR calculator takes the work out of calculating the ATR so that a trader can easily look at their ATR and see how much price of an asset has moved over a set of periods. In addition, the user can modify the set of periods to look at volatility trends of differing lengths of time, whether that be for short-term, or long-term. The ATR reading will then allow a trader to make evidence-based conclusions regarding stop-loss levels, how to determine position sizes, what to look for to get a breakout, etc. An ATR calculator will help a trader manage their risk and help them strike the optimal balance for their trading strategy by providing them with a clearer, more objective representation of price movement intensity.

Benefits of using Average True Range (ATR) calculator
Accurate measurement of market volatility
The ATR calculator accurately measures market volatility by averaging true ranges over a specific period. This helps traders to determine timeframes of high and low volatility when adjusting strategies to current market conditions. ATR values that fluctuate higher indicate a market with more price fluctuation, and lower numbers show an overall more stable market.
Better risk management and stop-loss placement
The ATR calculator captures recent volatility in price, enabling traders to employ stop-loss levels that have a direct correlation to the market. Wider stops in volatile markets can help you avoid being stopped too early, and tighter stops in calmer markets can lock in profits. By adjusting your stops dynamically based on ATR, we improve risk management and minimize unnecessary losses.
Better position sizing
Traders can utilize ATR in managing their position sizes based on volatility. The trader can take smaller positions during periods of higher ATR readings, limiting their overall exposure in chaotic markets and larger positions when the ATR is lower. This assures a level of risk regardless of the uptick in market volatility.
Identifying trend strength and breakouts
The ATR value will increase with strong trends and breakout situations that signal a change in momentum. The ATR calculator will enable traders to properly time their trades because they know the volatility is expanding, which usually means there is a substantial price to move on the horizon.
Objective and emotion-free trading
Since the ATR value is being calculated mathematically, that means the ATR calculator will provide traders with facts that are objective. This should help traders avoid emotional trading. When traders are able to have disciplined trades that are based on facts, the trader will be that much more advantageous than impulse driven or biased decisions.
Versatile across markets and timeframes
The ATR calculator can be used across a variety of markets, such as stocks, forex, commodities, and indices, among others. Furthermore, traders are able to dictate their own periods of measurement when using the calculator to fit their style of trading, whether it is short-term or long, as ATR can be utilized through all kinds of market environments.
Features of ATR (Average True Range) calculator
True range calculation made automatic
The ATR calculator will automatically calculate the True Range (TR) for each period by taking the greatest of the current high minus the low, and the absolute value of the current high minus the previous close, and the absolute value of the current low minus the previous close. This method is accurate because it allows for volatility calculation with gaps in price (often missed when not calculated automatically) without having to manually look around the chart for it (which is often a time-consuming exercise).
Dynamic volatility output
ATR automatically provides a continuously updated ATR value reflecting current volatility in the market. This dynamic output is designed to allow a trader to constantly monitor the changing market conditions in real time, allowing for timely decision-making.
Customizable period length
Users have the option to change the number of periods used in the calculation, usually shown as 14, but it can be any number from 2 to 50 depending on the timeframe and trading style. For a specific timeframe of future volatility, the most recent period is always taken to measure price movement. The “ATR” must be customized to the timeframe selected, just as it must be considered in terms of other periods in conjunction with respect to trends; or using a longer ATR to smooth for the trader who measures volatility for trend-following trading.
Visual customization options
Many ATR calculators contain the ability to customize the appearance of the ATR line, including color, thickness, and decimal precision. This makes reading the ATR output easier, as well as the possibility of integrating it into other charting tools.
Variety of averaging methods
The ATR calculator provides users with several methods of smoothing data, such as Wilder’s original smoothing, Simple Moving Average (SMA), and Exponential Moving Average (EMA). This provides flexibility for traders to decide which method is most appropriate for their own personalization of responsiveness and analysis.
Cross-market and timeframe compatibility
You can apply the ATR calculator to many different asset classes (stocks, forex, commodities, etc.) and timeframes (intraday, daily, weekly, etc.), thus making the ATR calculator a flexible and extensive tool for trading.
Average True Range (ATR) calculator strategies you should know
Volatility filter strategy
Using the ATR calculator to filter stocks or assets according to volatility levels. Traders can then screen for instruments with high ATR values if they prefer more volatile instruments or vice versa for less volatility. This practice does a better job of finding assets in line with a trader’s risk appetite or trading style, which ultimately improves the quality of trade setups.
ATR-based stop-loss placement
Adjust stop-loss orders as a multiple of the ATR below (for longs) and above (for shorts) the entry price. For example, a stop-loss can be set at 1.5 or 2 ATR distances for the buy entry. A stop-loss placed 1.5 ATR below the entry price, allows traders to protect themselves from normal market noise and also limit losses during unfavorable price moves.
Position sizing using ATR
Traders can adjust position sizes in relationship to the ATR value to keep risk entirely consistent across trades. The higher the ATR, the more volatile the market; hence traders will reduce position size to manage risk; the lower the ATR, allows for the larger position size meaning risk is equal to market conditions and preventing large exposure.
Breakout confirmation strategy
Use ATR to confirm breakouts when volatility is expanding. An increasing ATR as prices move indicates that momentum is strong and breakouts will be more reliable. Traders can enter a long or short trade when the price moves beyond the range by an ATR multiple, which will reduce the risk of being caught in a false breakout.
Trailing stop strategy
Traders can use a trailing stop based on ATR to lock in profits while still considering normal price movement. The stop follows the price movement but remains at a set distance from the price, based on ATR, keeping up to date with volatility changes to protect profits without exiting too early.
Mean reversion strategy using ATR
ATR can be combined with many oscillators like RSI to detect price moves that have moved too far, for volatile markets. If price moves lead to a high ATR reading, the trader will look for RSI conditions that would signal overbought or oversold conditions. Thus, when a mean reversion occurs, the trader has defined risk when entering a counter-trend trade.
Volatility breakout trading
Identify time periods with a low ATR (low volatility) and anticipate the spike in volatility with high ATR. Enter trades anticipating a breakout when ATR begins to sharply rise, and profit from significant price movements after price has been consolidated.
Dynamic support and resistance levels
Use ATR values to dynamically adjust support and resistance zones. A wider ATR indicates wider zones, while a narrow ATR indicates narrower levels. This will help traders build realistic targets and stop losses based on the level of volatility present in the market.
Risk-adjusted entry timing
Watch for changes in the ATR to help time entries more effectively. Enter trades when the ATR begins to climb, indicating more volatile conditions and a potential trend is being formed. Avoid entering trades when the ATR level is contracting, as this suggests stagnation or consolidation in the market with little to no short-term direction.
Combining ATR with Other Indicators
To further support trading decisions, ATR can be used alongside other indicators like moving averages and Bollinger Bands. ATR gives volatility context, while other indicators provide trend direction or momentum, which when used together can greatly enhance a trader's strategy for entry, exit, and risk management.
Pro tips for maximizing ATR (Average True Range) calculator accuracy
Set the ATR period dependent on the asset type
Change your ATR period according to the asset volatility type. For the most liquid forex pairs or the most volatile stocks, the ATR period is shorter (7-10) when expecting price volatility to change quickly; for slower-moving commodities, or futures, it is longer (20-25) to allow volatility to smooth out noise in price changes over time.
License using ATR to identify dynamic stop-loss levels
Calculate at what stop loss limit you are based on ATR multiples. You can base your stops at 1.5x or 2x current ATR value from the entry. Doing so allows the stop loss level to be dynamic in any situation based on volatility, which can help you not to exit a trade during normal market conditions.
Track the ATR heatmap across instruments
By looking at multiple instruments and their ATR values, a heatmap creates a visual reference of which assets are more or less volatile. This is important when trying to find the best opportunity to focus on. Again, look for direction for the next move (up .8 Atr, down .4 ATR, etc).
Adjust ATR setting regularly
The market can intrinsically change over time and render settings ineffective. That is why it is important to constantly go in and adjust ATR settings when appropriate. We recommend it once every few months, or after a significant market event. The most important thing is to calibrate so they are working alongside conventional volatility at the time of need.
Choose the right averaging method
Choose the proper averaging method, whether it be a Simple Moving Average (SMA), an Exponential Moving Average (EMA), or Wilder’s Average, depending on your trading plan. If your trading plan utilizes an EMA for price volatility, it will have a relative bias towards more recent data. This gives you a faster response to price volatility relative to SMA and Wilder’s Average, since both of these are lagging averages providing a smooth representation of volatility without bias versus more recent data.
Use ATR in conjunction with other measures
You can use ATR in conjunction with other measures like RSI or MACD to be more accurate with your signals. If you get a high value for ATR for the symbol you are signaling and then reflect on RSI indicating an overbought area, you may have a valid opportunity for a reversal providing more robust entry and exit points.
Track the ATR heatmap across instruments
By looking at multiple instruments and their ATR values, a heatmap creates a visual reference of which assets are more or less volatile. This is important when trying to find the best opportunity to focus on. Again, look for direction for the next move (up .8 Atr, down .4 ATR, etc).
Consider the market regime
Understand how current market conditions are affecting the ATR. During an unexpected high volatility event like earnings announcements for stocks and economic announcement for forex, the immediate spike in the ATR value is what happened – depending upon what followed in the market on the price chart, changes in the ATR value might not mean anything other than that the market regime changed in a matter of minutes, and it may have changed back. Develop your trading strategy in the context of changes in market conduction such that you might widen your stop-loss limits, for example.
Use ATR in conjunction with position sizing
You can use ATR in position sizing calculations to help manage risk. In times of high ATR, you can reduce position sizes to limit your potential loss during volatility, and in times of low ATR, you can increase position size indicating calmer markets.
Do not forget about the time of day
When considering volatility in stock/futures/forex markets it is also important to account for the time of day. For example/forex pairs is often significantly more volatile during the overlapping times of the London and New York market sessions for a currency pair. Use of the ATR settings may have to change during these times when you hope to squeeze the volatility or avoid said volatility.
Confirm with volume study
Check out an ATR marking along with how the volume indicator reads. An ATR rising with volume also rising signals some degree of group conviction in the direction of price. Volume showing divergence from ascending ATR when the price takes a sharp turn without aberrant market conditions or events may be a false signal.
Back-test different ATR settings
Test different ATR periods and different settings to see how they fit best with your trading style and instruments. You may find the best back-test results for your markets by qualifying and quantifying the proper parameters to work with over multiple periods of back-testing.
Gaps matter
Price gaps are ubiquitous in price analysis and trading decision making, especially in stocks/futures. Be sure to also include price gaps within your ATR calculation if they are a concern. The True Range calculation does take price gaps into consideration by referencing the high/low of the current price with the previous closing price.
How to use the Average True range calculator?
Step1: Choose your time frame
- Pick the period over which you want to measure the ATR. The conventional setting is 14 periods (days, hours, etc.) but this can be altered depending on your trading style and volatility of the asset. You can consider periods 2–10 to capture the most recent volatility, or you can use longer periods (20–50) to smooth out the bounces & ride longer term trends.
Step 2: Gather price information
- Record the high, low, and previous close prices for each period for the time frame you have chosen. You will need the previous close prices to calculate the True Range (TR) for each period.
Step 3: Calculate True Range (TR) per period
- For each period, calculate the True Range which is the maximum of the following:
- Current high minus current low
- Absolute value of current high minus last close
- Absolute value of current low minus last close
- This incorporates price gaps and limit moves to provide a more accurate measure of volatility.
Step 4: Initial ATR value calculation
- Calculating your initial ATR value is done by taking the simple average of the True Range values over your chosen initial period (say the first 14 TR values). The result is the initial ATR value.
Step 5: Subsequent ATR values calculation
- For every subsequent period that you want ATR values, you will employ this smoothing methodology:
Current ATR = (Previous ATR×(n−1)) + Current TR/n
Where n is the number of periods (ex: 14). This ensures that you give consideration to the most recent price changes while adapting to historical volatility.
Step 6: Input data into ATR calculator
- In the case of your ATR calculator being automated, whether through software or platform, you will input your price data, or select the asset and timeframe, and your ATR calculator will automate the mentioned steps to provide you with real-time ATR values.
Step 7: Interpreting the ATR output
- The ATR value reflects price variation for average volatility over the period of your choice. The fact that the ATR value is higher means more price movement; while less price volatility would mean an ATR number that is lower. The ATR output can assist you when making your next trading decision.
Step 8: Use ATR to establish stop-loss
- When utilizing ATR, place stop-loss limits dynamically at either side of your entry price by a multiple ATR. This method ensures that an otherwise valid trade is not stopped by normal volatility in the market.
Step 9: Adjust ATR period for each market
- Each asset class can be different, so adjust your ATR period accordingly. For example, a trader may choose a relatively short ATR period for trading a more volatile market like forex or stocks, while choosing a longer one for trading a more stable market like some commodities or futures.
Step 10: Strategically combine ATR with indicators
- You can combine ATR with some trend or momentum indicators to provide additional confirmation for your trade signals and to identify volatility shifts.
Step 11: Continue to calculate ATR
- Continue to calculate and update ATR for each price period to ensure your ATR calculations are relevant until you have exited the trade.
Step 12: Backtest your ATR periods
- Using historical data, backtest different ATR periods and smoothing methods in order to identify appropriate options for your style of trading and asset. This will enhance the usefulness of your volatility assessments.

ATR calculator vs other forex indicators
The Average True Range (ATR) calculator is unique among forex indicators because it is the only indicator that only provides a measurement of market volatility, not price direction or momentum. As a measure of market volatility, ATR is not a trend-following indicator like Moving Averages, or momentum indicators like MACD and the Stochastic Oscillator. Instead, ATR measures actual price movement by calculating the average true range over a set period, which also considered gaps and limit moves. ATR is firmly rooted in price behavior and is great for setting dynamic stop-loss levels and position sizing. It is especially valuable when managing environments with greater volatility in your trades including forex trading, commodities, futures, and stocks.
Traders using indicators like MACD and RSI receive signals about whether prices are breaking out with strength or hitting overbought or oversold conditions, but the ATR calculator offers traders a different perspective by indicating how much an asset’s price typically moves in a direction, even if it was down at the same time. This ability to measure volatility is important if your strategy needs to adapt its price movement to changing market conditions-it is imperative in forex as prices can swing wildly in short timeframes. Furthermore, ATR can be applied universally across timeframes and asset classes, which is appealing versus some other indicators that may only perform positively in heavily trending or range-bound markets.
Conclusion
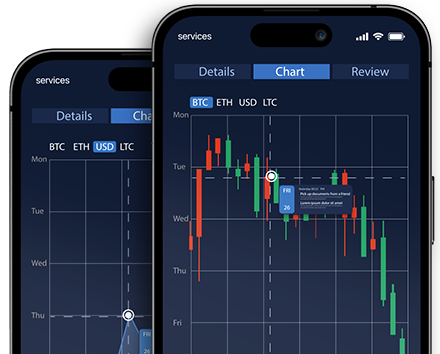
- At Thaurus, we recognize the critical role of the Average True Range (ATR) calculator in empowering traders to effectively measure market volatility and manage risk across diverse financial instruments such as forex, commodities, futures, and stocks. At Thaurus, you will find a sophisticated ATR calculator integrated into an easy-to-use interface, giving traders of all experience levels immediate access to volatility data and insights in real-time.
- This allows users to set dynamic stop-loss limits, position sizes, and modify their plans based on market variability with much more confidence than possible without insights derived from the ATR. In addition to being able to leverage the use of an ATR calculator to inform your execution-based volatility decisions, Thaurus has combined the ATR calculator with our extensive risk management controls (stop-loss limits, charting tools, engineered markers) and real-time market data to allow users to make as informed a decision as possible in a fast-moving market. All assets are tradable as long as they are available on the exchange, and Thaurus has very intuitive alert features that let users be the first to be aware of changes in volatility and other potential client opportunities.
- Thaurus has developed an insightful and helpful environment to enable traders the greatest possible opportunities to gain the benefits of using an ATR with trading strategies keeping risk management at the foundation of their trading experience. Customers can also trade across multiple accounts, while having confidence in Thaurus’s breadth of security features and around-the-clock customer support. We’ve made mobile trading seamless as well.
- In summary, the integration of the ATR in the Thaurus application has put a tool in the hands of users to improve their discipline, precision, and outcomes, which we believe is an indispensable piece of the trading journey.
- Contact us to learn more about the Average True Range calculator and our team will get back to you in 24 hours.
Don't miss out on the great market opportunities
Join the world of trading and start building your wealth today!