Forex Heatmap: How to Use Currency Strength to Improve Your Trades
- Forex
- August 25, 2025
- No Comments
- Thaurus
- A forex heatmap has transformed how traders evaluate currency movements and make real-time decisions. It does not matter if you are using a basic trading platform or an effective forex trading platform; incorporating heatmap trading into your strategy can effectively improve the precision of your trades. This basic tool enables traders to recognize the strongest and weakest currencies quickly, which helps to make smarter and more profitable decisions. In this blog, we are going to explore how Forex heatmap works, why understanding currency strength is critical, and how you can use this tool to enhance your trades.
What is a forex heatmap?
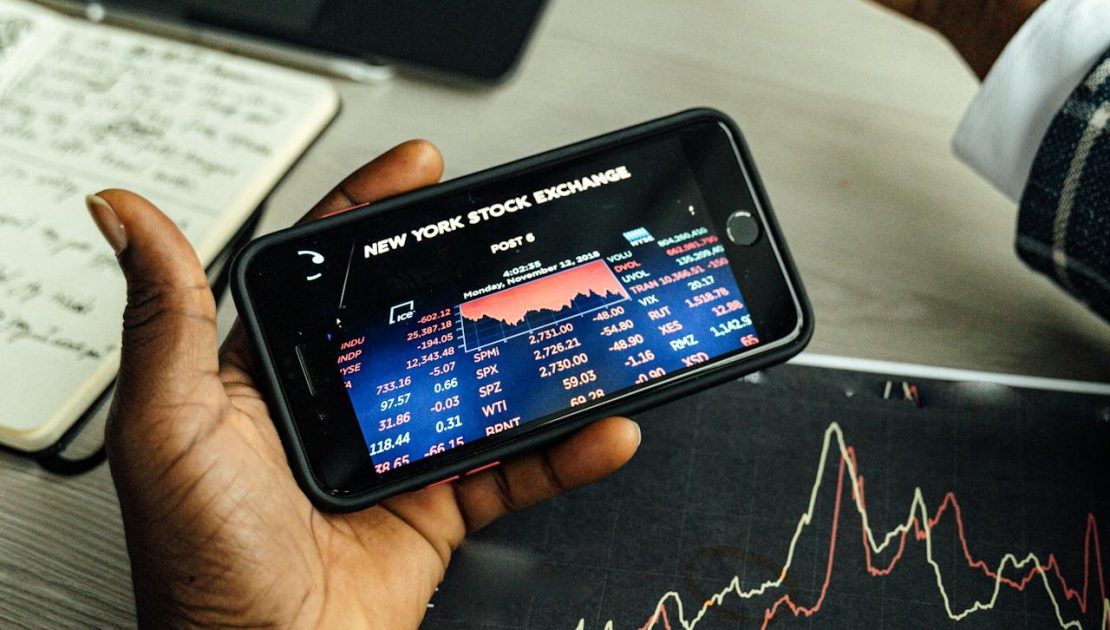
- A forex heatmap refers to a visual tool that shows the relative strength or weakness of major currencies against each other. This is usually done using color-coded data in order to easily interpret. The heatmap organizes information from various currency pairs, usually the 8 major currencies and their cross pairs, into a grid or map, where each cell showcases the performance of one currency relative to another currency. As per a study done by Trading View in the present scenario the forex market is the largest financial market worldwide with an average daily trade volume of more than $5 trillion. The US dollar is involved in more than 87% of all trades.
What is currency strength?
- Currency strength stands for the relative value or purchasing power of a currency when compared to other currencies or goods and services. It is mainly a measure of how much a unit a currency can purchase both internationally and domestically, and is impacted by multiple economic factors like interest rates, trade balances, inflation, along with overall economic performance. In the context of forex trading, currency strength is usually evaluated by comparing one currency against a basket of others, by using the US Dollar Index (USDX).
- There are mainly two types of currency strength, these are:
- Relative strength- It is based on recent market movements and volatility. Absolute strength- It is based on the political as well as economic stability of a country.
- Furthermore, a fore heatmap also offers a snapshot of relative strength, which is more useful for short-term trading strategies.
How does a forex heatmap work
- A forex heatmap works by visually showcasing the relative strength and weakness of main currencies against each other by using a color-coded grid. The heatmap gathers and updates real-time price data from various currency pairs, usually covering the 8 major currencies and their 28 cross-pairs. Each cell in the grid demonstrates a specific currency paid; the color of the cell showcases the strength and weakness of that pair. Here is what each color represents:
- Red- This color showcases weakness or bearish momentum for the base currency in the pair.
- Green– This color demonstrates strength or bullish momentum for the base currency in the pair.
- Neutral or grey color- It shows little or no change in the price action.
- The degree of strength and weakness can be predicted by the intensity of the color.
- Furthermore, users can also select different timeframes, such as 1 minute, 1 hour, and daily, to evaluate trends from short-term as well as long-term perspectives. By scanning the heatmap, traders can easily recognize which currencies are going strong or weak in the market and help them spot trading opportunities and also avoid risky trades. The heatmap also highlights additional trading opportunities in the related currency groups and warns where signals are mixed, which helps traders to avoid false entries and disrupting conditions.
- Each row and column in a heatmap usually represents a currency, and the intersection displays the performance of a currency pair. Various green cells for a currency across various pairs and timeframes suggest strong bullish momentum, while multiple red cells showcase bearish momentum.
Advantages of using a forex heatmap in trading
Better risk management
- Forex heatmaps make it easy to avoid trading weak and volatile currencies. This assists traders in managing risk by focusing on pairs with clearer trends and reducing exposure to choppy markets.
Better visual analysis
- A heatmap provides an immediate and color-coded overview of the strengths and weaknesses of a currency, enabling traders to easily scan the market and recognize trends as well as outliers within minutes.
Better decision market
- By visually showcasing market dynamics along with liquidity, forex heatmaps assist traders to make faster and more informed decisions regarding the entry and exit points, and also adapt to changing market conditions.
Simplify complex data
- Traders can easily use the visual format of a heatmap to understand complex market information at a single glance, instead of evaluating multiple charts and large data sets. This makes the forex heatmap useful for beginners and experienced traders.
Strategic planning and confirmation
- Heatmaps also reveal correlations along with patterns among multiple currency pairs, which support strategic planning and confirmation of trade by aligning trades with enhanced market sentiment.
How to use currency strength to enhance your trades
- Currency strength is considered to be a powerful concept that can majorly improve trading results by enabling traders to recognize the best currency pairs to trade and how to trade them. Here is how you can use currency strength to your advantage:
Step 1: Recognize the strongest and weakest currencies
- The main strategy is to purchase the strongest currencies and then sell the weakest. This will increase the chances of catching a strong trend, as you are trading in the direction of gaining momentum. For instance, if the NZD is the strongest and the CHF is the weakest, you need to search for buying opportunities in NZD/CHF.
Step 2: Take help from currency strength tools
- You can also use a currency strength meter or even a heatmap to get a real-time, visual overview of which currencies are going strong or weak. These tools collect price data from various pairs and timeframes, which makes it easy for traders to recognize opportunities and avoid inconsistent trades.
Step 3: Apply currency strength in different strategies
- Trend reversal– Search for extreme readings where a currency is overpurchased or oversold, but be cautious as reversals are risky and trends can persist longer than needed.
- Multi-timeframe evaluation– You also need to confirm that a currency is weak or strong across multiple timeframes for higher conviction trades. The more time frames that display strength or weakness, the stronger a trend is going to be.
- Trend-following– Pair the strongest currency with the weakest and then trade in the direction of the trend.
Step 4: Confirm with the fundamental and technical evaluation
- Use the currency strength filter along with your existing technical and fundamental evaluation. For instance, if your chart analysis suggests a purchase and the currency strength meter is also showing strength, then the setup of the trade is getting stronger. You need to avoid trade where the heatmap and meter shows mixed and inconsistent signals, as this will indicate choppy and sideways markets.
Step 5: Monitor for changes and manage risk
- Currency strength can change rapidly, especially after news events and volatile situations. You need to keep an eye on strength readings to manage open trades and adjust your strategy when needed. You can also stop losses along with proper risk management, as even the strong trends can reverse all of a sudden.
Conclusion
- On coming to the conclusion, using a forex heatmap is an effective way to visually control market trends and recognize trading opportunities on the basis of currency strength. When it is used with technical indicators as well as effective risk management practices, it can significantly increase your success rate in the market. If you are searching for reliable tools and expert services in currency analysis and trade optimization, then Thaurus is your destination. The platform provides cutting-edge solutions personalized to forex trades, along with advanced trade analytics, professional insights, and a currency strength meter that are perfectly aligned with the heatmap-based strategies.
- Contact us, and our team will get back to you in 24 hours.